Need some time wasters to get through your workday? How about some topics for you and your friends to debate over at the bar? That’s what Sports Scenarios is here to provide. Each week I’ll present a series of thought provoking questions and statements for fans of all sports. Some will be more serious analytical propositions while others will be downright stupid and fun. Assume all athletes are in their prime unless stated otherwise. Comment, like, and share if you enjoy. Let’s get the debate started.
If Jose Altuve faced 100 pitches from a machine simulating John Isner’s serve, how many hits would he get?

How would Jose Altuve’s speedy bat perform in a clash against John Isner’s explosive serve? Before we can attempt to answer that question, let me setup the situation. Altuve gets 100 swings against a pitching machine that simulates Isner’s serve. This machine is guaranteed to locate all pitches within the strike zone. The machine will be placed at the standard mound distance of 60 feet 6 inches from home and the ball will cross the plate before the bounce. Baseballs will be used, there will be fielders, and Altuve needs to run out every hit.
Let’s get into the details of the the “pitch” Altuve will be facing. A sample of 1140 Isner first serves from 2017 (Isner 2017 Serve Stats) revealed an average speed of 122.3 mph. Of those serves, 359 were aces (31.49%) and 648 were unreturned (56.84%). Those numbers clearly illustrate how difficult it is to make clean contact even with a racquet that has far more surface area than a bat. Once the speed was determined I had to figure out the height of the release point. A 2012 article (Serve Contact Height) placed Isner’s highest point of contact at just over 11 feet. Let’s assume this remains consistent and place the machine at that height. Additionally, the machine will also be set to imitate the spin of the ball as it comes off Isner’s racquet.
Pitch Summary: 122.3 Mph with a release point of 11 ft imitating the spin on Isner’s serve
I’ve chosen the height challenged Jose Altuve for this tall task because he has proven himself to be one of the best contact hitters in all of baseball. With an outstanding .335 average over the last 4 seasons, 3 of the last 4 AL batting titles, a low strikeout rate, and the speed to leg out infield hits, he seemed like the man for the job. Some other candidates that I considered were Daniel Murphy, Joey Votto, and Mike Trout.
To gain some perspective on how pitch speed effects batters I took a look at the 50 fastest pitches of 2017 (Fastest Pitches 2017). Those pitches resulted in 3 hits (2 singles and a homerun), 8 balls, 9 swinging strikes, 5 called strikes, and 25 contact swings that were either foul or out. The fastest pitch topped out at 104.3 Mph from Aroldis Chapman who accounted for 44 of the 50 fastest pitches thrown in 2017. Altuve has limited experience against the powerful hurler but is 1 for 4 against Chapman in his career with no K’s.
So after breaking down the numbers, how would Altuve fare? I have no fucking clue. I went down a deep rabbit hole on this one and had to stop before I lost all sanity. I’m setting the over under at 4.5 hits.
The best all time NBA tag team wrestling duo would be Boban Marjanović and Gheorghe Mureșan.
I haven’t watched wrestling in many years but this would be a spectacle worth tuning in for. Gheorge Muresan (7’7″ 315 lbs) and Boban Marjanovic (7’3″ 290 lbs) have the size to captivate an audience along with with athleticism to entertain them. Wrestling has a long stroried past of giants finding success in the ring and these monsters would clock in as two of the largest ever to step between the ropes. On top of that, they both have unusual mobility for men of their size suggesting that they may be able to pull off some crowd pleasing maneuvers.
To illustrate my point, I’ve taken the liberty of choosing one possible character choice for the duo. 7+ foot killer clowns. Not the most original idea I’ll admit but take one look at the picture below and tell me with a straight face that you wouldn’t be terrified…
Let me know if you can think of any candidates that would be better than these 2 in the comments.


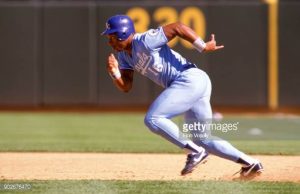
What would be the success rate for Usain Bolt regarding steals of home plate?

Stealing home plate is one of the most exciting and difficult plays to pull off in all of sports. Runners often find themselves on the losing side of this pursuit with a success rate that lies somewhere around 25% between the years 2000 -2015 (Steals of Home Since 2000). There are many factors that play a crucial role in determining the outcome of this difficult grand theft. Instincts, anticipation, timing, ability to read the pitch and of course speed are all significant factors. In this scenario we push one of those factors, speed, to the extreme by putting the fastest man ever, Usain Bolt, on the basepath.
While speed is clearly an important factor, statistics show us that it alone will not lead to success. If speed were the only determining factor, Chase Utley (87.79%) and Carlos Beltran (86.43%) would not sit at number 2 and 3 in the all time steal percentage rankings. To put things into perspective, let’s examine other speedy crossover athletes who stepped onto the diamond.

Football/baseball star and superhuman athlete Bo Jackson ranks 301st in regards to all time steal percentage. He checks in with a 71.93% success rate despite logging a controversial but legendary 4.12 40 time at the 1986 NFL combine. Fellow football/baseball phenom Dieon Sanders ran a 4.27 at the combine, but his 74.7% steal percentage barely cracks the top 200 coming in at 199. One of the fastest active MLB players, Billy Hamilton, has been top 3 in steals over the last 4 years. According to Hamilton, he last ran the 40 yard dash in the 9th grade and ran a 4.5. While he surely is faster now, his time would still pale in comparison to Bolt’s 40 that would clock in at sub 4 seconds if timed by NFL standards according to this detailed article. (Bolt 40 Time).
Here are some more numbers to consider. It’s about 88 feet between basemarkers so with a 10 foot lead Bolt would need to travel about 78 feet (23.77 Meters). According to the chart below, Bolt would need somewhere around 3.22 seconds to cover that distance on his feet.

Shave off a bit more time for the slide and I’d say he is reaching home 3.1 flat. According to this article (Pitcher Delivery Time), the average pitcher delivery took 1.4 seconds in 2013. Depending on the jump, that leaves the catcher approximately 1.7 seconds to receive the pitch and place the tag before Bolt touches the plate.
As I stated earlier, stealing bases is about much more than speed. That being said, the MLB has never seen anyone with the speed of Bolt and that certainly is a factor that can’t be ignored.
So, this leaves me with 2 questions for you.
- What would Bolt’s steal % be when attempting to steal home?
- Game 7, bottom of the 9th, 2 outs, man on third… You’re obviously putting Bolt in, but are you sending him?
Bonus Clip: Can’t talk stealing home plate without throwing in the clip Benny “The Jet” Rodriguez. Sorry for the terrible quality but it’s the best I can find.
Who would win in a matchup between the 2017 Browns (o – 16) and the 2008 Lions (0 – 16)?

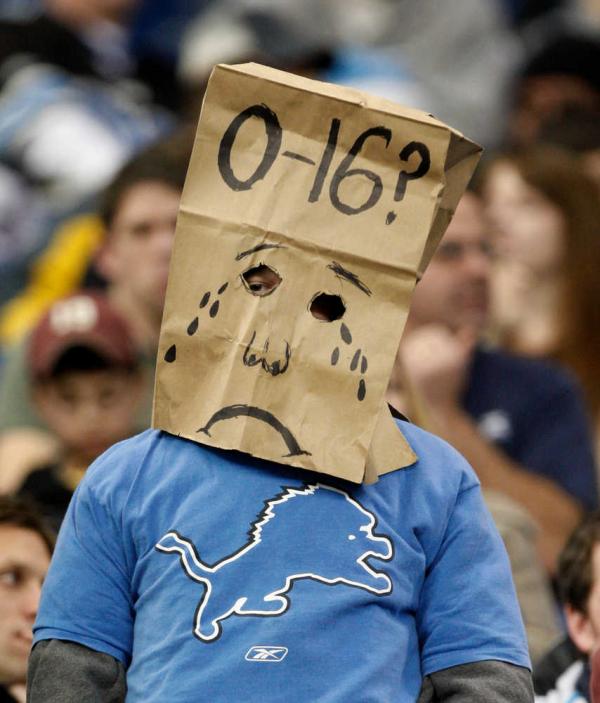
I’m sure the 2008 Lions can find some solace in the 2017 Browns joining them in the shameful 0-16 club. After all, misery does love company. Both franchises put forth impressively pathetic showings leading to the only defeated seasons in the 39 years since the NFL switched to a 16 game schedule. This inevitably begs the question of which team would emerge victorious if they faced off in a bowl game determining who sets the standard for failure in modern professional football. I’ve crunched the numbers to determine a winner and here is what I found.
Statistically, both teams are remarkably pathetic. Each squad lost 10 or more games by more than 1 score, but the Browns were slightly more competitive. The Lions had 5 games within 8 points while the Browns had 6. It must be noted that the Browns took two of those games to overtime showing that they certainly had more opportunity to come away with a win. Additionally, the Lions had a -249 point differential to the Browns -176. The significant difference in point differential is the Lions historically bad defense which let up the second most points per game (32.3) since the transition to 16 games. While the Browns were clearly better on defense (25.6 PPG) the Lions had a slight edge offensively outscoring them 268 to 234. They also had the best player on the field in Calvin Johnson who somehow managed to rack up 1,331 yards recieving and 12 touchdowns on that pathetic squad quarterbacked by the gunslinging trio of Kitna, Culpepper, and Orlovsky.
Despite the slightly superior offense and lengendary Calvin Johnson, that Lions defense is just too bad to overlook. For this reason I have to speculate that the Browns 0 would go leaving the 2008 Lions as the worst NFL team in the modern football era.
Score prediction: Browns 24 Lions 16
Bonus Clip: This play from Dan Orlovsky during that 2008 campaign sums up the story of that season
That’s it for the first installment of Sports Scenarios folks. Leave your opinions, criticisms, thoughts, hate, suggestions, arguments, encouragement, or whatever comments you feel below. Now back to the theme song to play us out.


4 thoughts on “Sports Scenarios Week 1: Isner’s Serve vs. Altuve’s bat, Usain Bolt Stealing Home & More…”